

Introduction:
In a world where online services and applications are more critical than ever, monitoring their availability and performance is essential. One such tool that has gained popularity for its simplicity, elegance, and open-source nature is Uptime Kuma. This blog post will provide an in-depth guide on how to install, configure, and use Uptime Kuma, as well as how to set it up with Nginx as a reverse proxy.
Uptime Kuma is a self-hosted monitoring tool that allows you to keep track of your services’ uptime and response times. Built on Node.js, it is both lightweight and user-friendly, making it suitable for both small-scale projects and large-scale deployments. With Uptime Kuma, you can monitor services using HTTP(s), TCP, or ICMP, and receive notifications via various channels, such as email, Slack, Telegram, or Webhooks, if any of your services go down.
How to Install Uptime Kuma:
There are several methods to install Uptime Kuma, but this guide will focus on using Docker Compose, as it simplifies the process and enables easier management. Before proceeding, ensure that you have both Docker and Docker Compose installed on your server.
To get started, create a new directory for your Uptime Kuma installation:
mkdir /opt/docker/kuma
cd /opt/docker/kuma
Next, create a docker-compose.yml file in the /opt/docker/kuma directory, and paste the following configuration:
version: '3.3'

services:
  uptime-kuma:
    image: louislam/uptime-kuma:latest
    container_name: uptime-kuma
    volumes:
      - /opt/docker/kuma/:/app/data
      - /var/run/docker.sock:/var/run/docker.sock
    ports:
      - 127.0.0.1:3001:3001
    restart: always
This configuration defines a single service, uptime-kuma, which uses the latest available image of Uptime Kuma. It maps the /opt/docker/kuma directory on the host to the /app/data directory inside the container, where Uptime Kuma will store its data. It also maps the Docker socket file, which is useful if you plan to monitor your Docker containers. Finally, it maps port 3001 on the host to the same port inside the container.To start the Uptime Kuma container, simply run:
docker-compose up -d
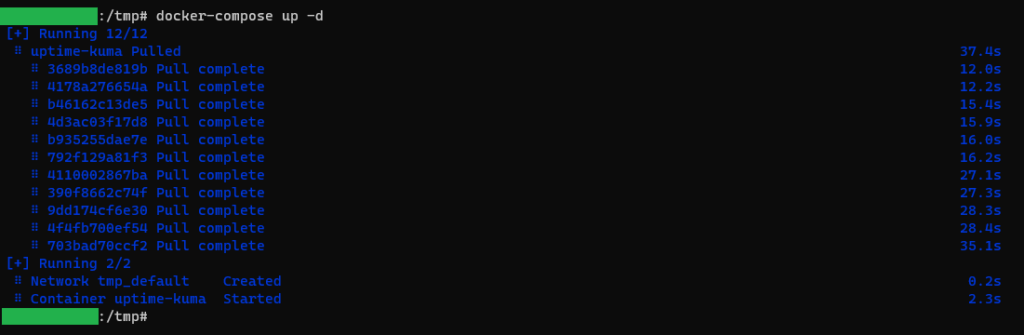
Uptime Kuma should now be running and accessible at http://127.0.0.1:3001. You can complete the setup by creating an account and configuring your desired monitoring settings.
Configuring Nginx as a Reverse Proxy:
To make Uptime Kuma accessible via a domain name and enhance security, you can use Nginx as a reverse proxy. If you haven’t already, install Nginx on your server, and then create a new Nginx configuration file for your domain:
sudo nano /etc/nginx/sites-available/domain.com
Paste the following configuration, replacing domain.com with your desired domain name:
server {
  server_name domain.com;
  listen 80;

  location / {
    proxy_pass http://127.0.0.1:3001/;
    proxy_set_header X-Real-IP $remote_addr;
    proxy_set_header   X-Forwarded-For $proxy_add_x_forwarded_for;
    proxy_set_header   Host $host;
    proxy_http_version 1.1;
    proxy_set_header   Upgrade $http_upgrade;
    proxy_set_header   Connection "upgrade";
}
}
This configuration listens on port 80 for the specified domain name and proxies incoming requests to the Uptime Kuma instance running on http://127.0.0.1:3001. It also sets various headers to ensure proper forwarding of client information and to enable WebSocket support.
Save the configuration file and create a symbolic link to the sites-enabled directory:
sudo ln -s /etc/nginx/sites-available/domain.com /etc/nginx/sites-enabled/
Next, test the Nginx configuration for any syntax errors:
sudo nginx -t
If the configuration test passes, reload Nginx to apply the changes:
sudo service nginx reload
Uptime Kuma should now be accessible via your domain name. For enhanced security, consider obtaining an SSL certificate and configuring Nginx to use HTTPS.
Configuration:
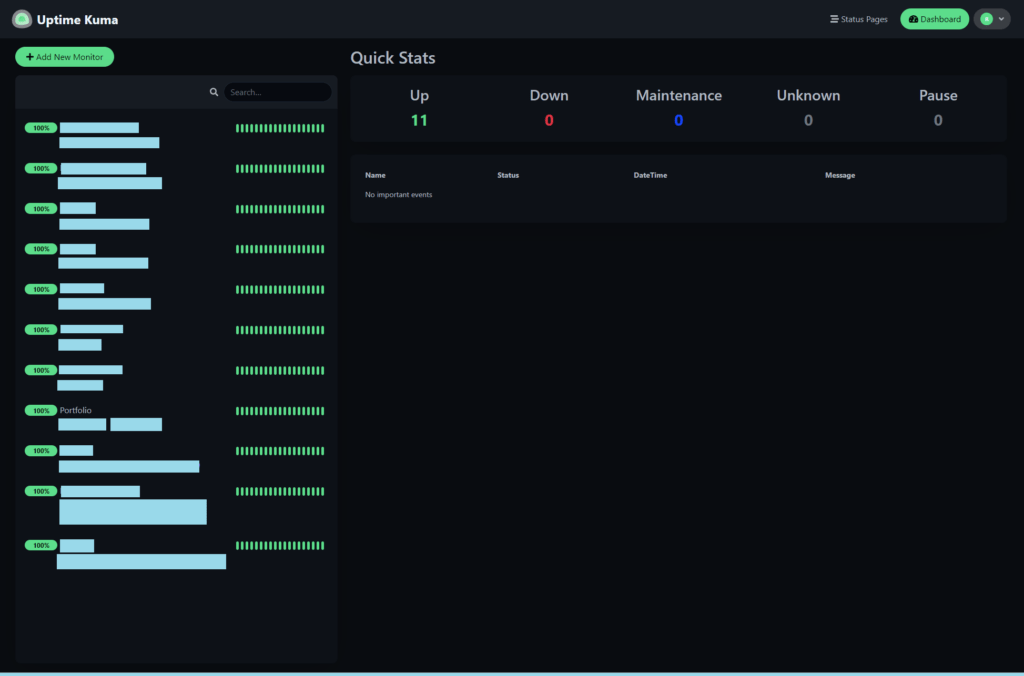
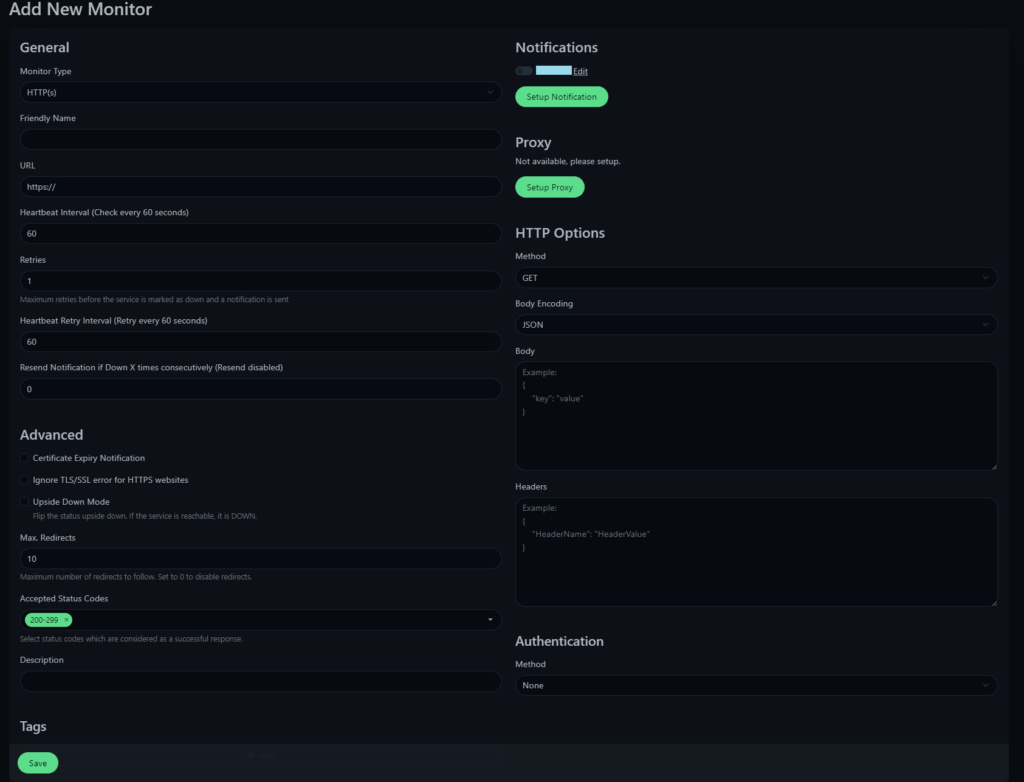
With Uptime Kuma installed and accessible, you can start configuring it to monitor your desired services. Log in to your Uptime Kuma instance and navigate to the “Dashboard.” Click the “+” button to add a new monitor.
You will need to provide the following information:
– Monitor Type: Choose between HTTP(s), TCP, or ICMP to monitor your service.
– Friendly Name: Enter a descriptive name for the service.
– URL/IP: Provide the URL or IP address of the service you want to monitor.
– Interval: Define the time interval (in minutes) between monitoring checks.
Additionally, you can configure advanced settings, such as custom HTTP headers, expected status codes, or response time thresholds.
To receive notifications when a service goes down, head to the “Settings” tab and configure your desired notification channels. Uptime Kuma supports email, Slack, Telegram, and Webhooks, among other options. Make sure to test the notification settings to ensure they are working as expected.
Final Word:
Uptime Kuma is a powerful and user-friendly monitoring solution that allows you to keep a close eye on your services’ uptime and performance. Its open-source nature and flexibility make it suitable for a wide range of projects and deployments. By following this guide, you have successfully installed Uptime Kuma using Docker Compose and configured Nginx as a reverse proxy. Now you can start monitoring your services and receive notifications in case of any downtime, ensuring that you can address issues promptly and maintain a high-quality user experience for your clients.